
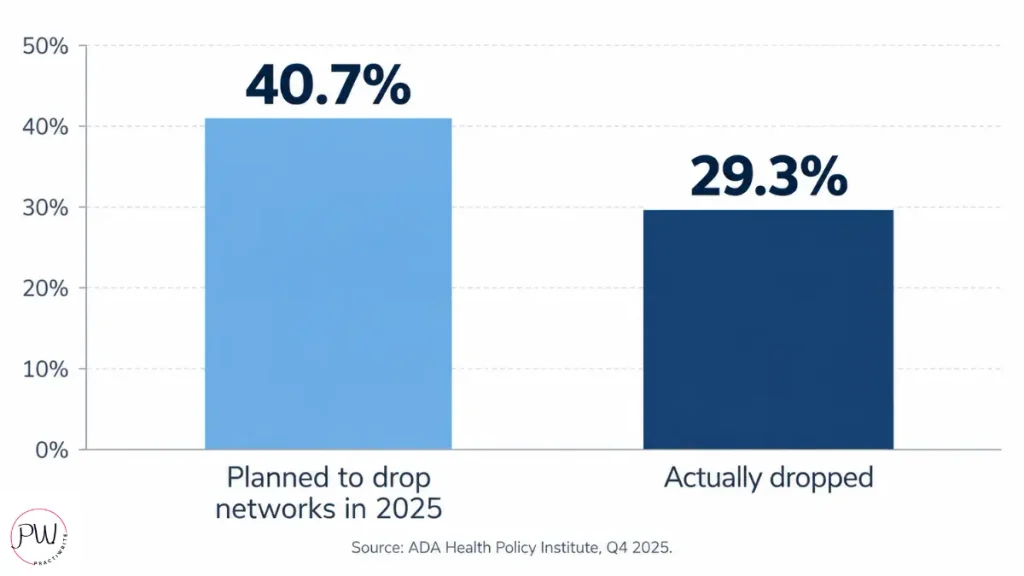
In 2025, 40.7% of dentists planned to drop out of at least some insurance networks. Only 29.3% actually did it.
That gap has a name, and it isn’t “bad timing.” It’s the fear of empty chairs.
Here’s what keeps that fear alive. Most dentists judge their marketing on a PPO scoreboard, even after they’ve decided to leave PPOs behind. And on a PPO scoreboard, fee-for-service vs PPO dental marketing looks like a losing fight.
Fewer calls. Fewer new patients. A schedule that doesn’t look slammed.
So here’s the straight answer. Fee-for-service and PPO marketing results look different because the two models measure completely different things.
PPO marketing counts patients, because insurance sets the price of every visit and volume is the only lever left. Fee-for-service marketing results counts case value, case acceptance, and patient fit.
That means a fee-for-service practice can see fewer new patients and more production in the same month. That’s not a warning sign. That’s the strategy working.
PPO-based practices run on volume. Fee-for-service practices run on quality. Measure a quality practice with a volume ruler, and you’ll panic at the exact moment your marketing starts paying off.
I’ve watched it happen.
One solo dentist came to me after eight months and $7,400 in Google Ads with an agency that grew his calls by 72%. Sounds great, right? Over 60% of those calls were insurance shoppers.
His marketing was a success. Just not for the practice he was trying to become.
So what should a fee-for-service practice measure instead? Let’s get into it.
Why Do Fee-For-Service Vs PPO Dental Marketing Results Look So Different?
Fee-for-service vs PPO dental marketing results look different because each model is built to solve a different problem. PPO marketing is built to fill the schedule. Fee-for-service marketing is built to fill the schedule with the right patients.
Same tools, same channels, completely different definition of “it’s working.”
Here’s how the two scoreboards compare:
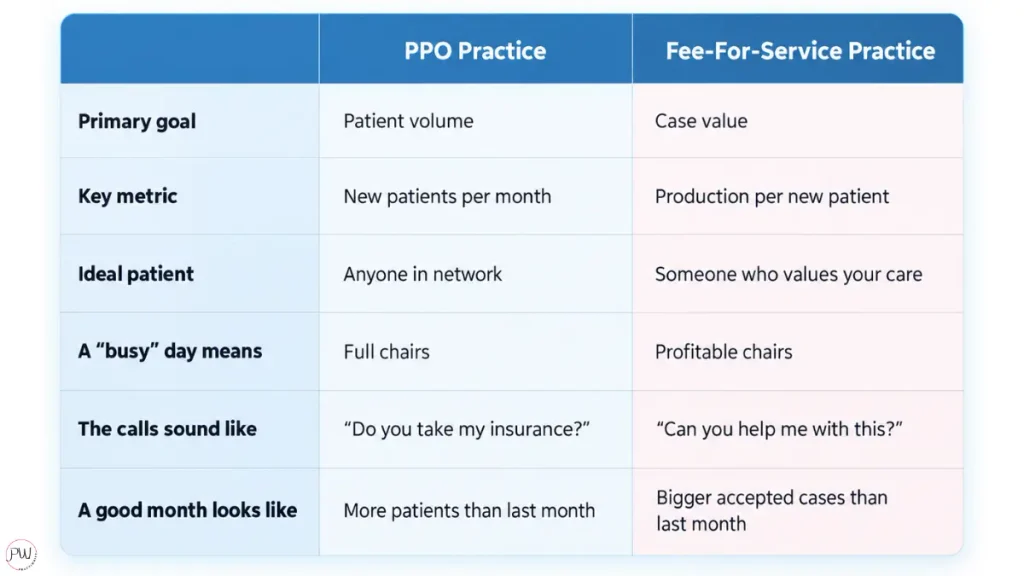
Neither column is wrong. They’re just answering different questions.
The trouble starts when a fee-for-service practice gets graded with the PPO column. So which scoreboard is your marketing report using?
Why Does PPO Dental Marketing Have To Chase Volume?
PPO dental marketing chases volume because insurance reimbursement sets the price of every visit, and that price isn’t keeping up with the cost of running a practice. When each visit pays a little less every year, the only way to grow revenue is to see more people.
Volume isn’t a strategy PPO practices choose. It’s a math problem they’re stuck solving.
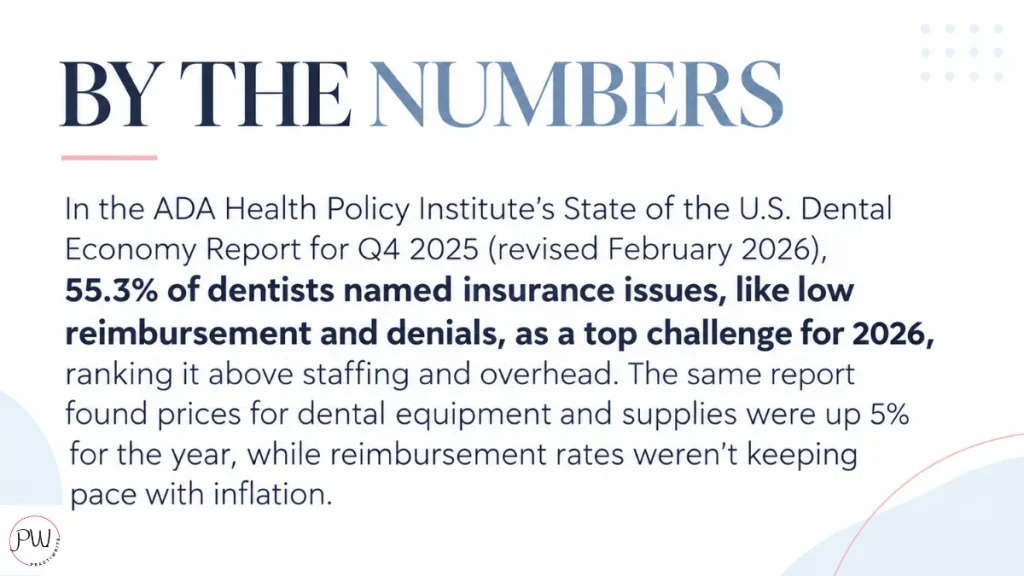
Translation: Costs go up, reimbursement doesn’t, and the gap gets filled with more appointments. PPO marketing isn’t dumb. It’s doing exactly what PPO economics demand.
But if you’ve raised your fees and stepped away from insurance, why would you keep paying for marketing designed to solve a problem you no longer have?
What Does Fee-For-Service Dental Marketing Actually Measure?
Fee-for-service dental marketing measures how much each new patient is worth, not how many new patients walk through the door. The goal isn’t a crowded waiting room. It’s a schedule full of patients who value your care, accept treatment, and pay your fees without flinching. These are the numbers that matter:
- Production per new patient. What each new patient produces in their first year, not just their first visit.
- Case acceptance rate. The percentage of presented treatment plans patients actually say yes to.
- High-value consults booked. How many calls turn into consults for implants, cosmetic work, and full-mouth restorations.
- Patient fit. The ratio of “Do you take my insurance?” calls to “When can I come in?” calls.
- Review rating and recency. Fee-for-service patients choose on trust, not on a network directory, so your reputation is part of the scoreboard.
Notice what’s missing? Impressions, clicks, and raw call volume. They’re useful early signals, but they’re not results. A fee-for-service practice that celebrates call volume is a bit like a restaurant celebrating how many people read the menu.
Why Can Fewer New Patients Mean More Revenue?
Fewer new patients can mean more revenue when each patient accepts more valuable treatment at your full fee. A fee-for-service practice doesn’t need to win on headcount. It needs to win on what each patient is worth.
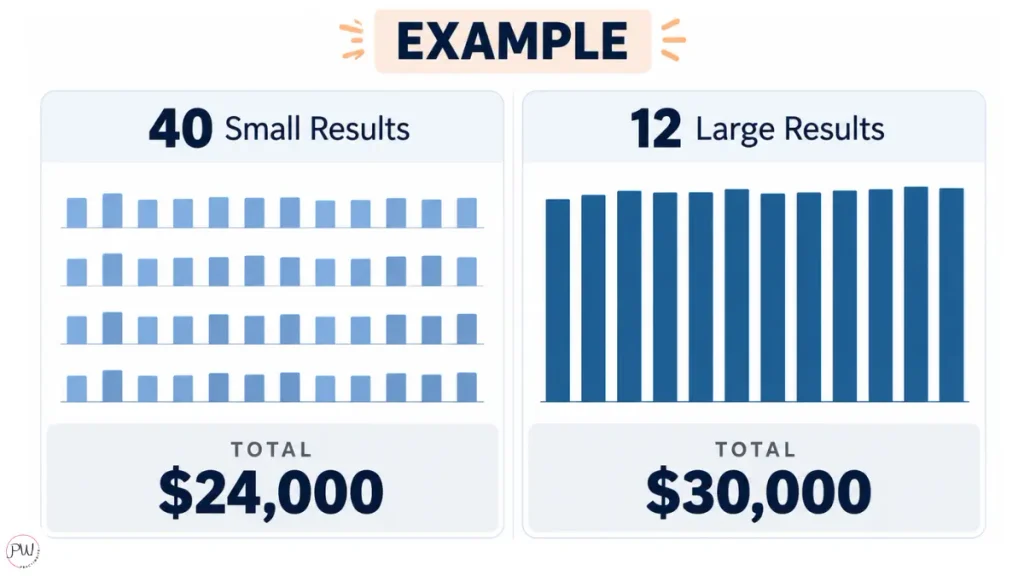
Here’s a simple illustration, using round numbers to show the math, not real practice data.
Say a practice brings in 40 new patients in a month, and each produces $600 in their first year. That’s $24,000. Now say a different month brings in only 12 new patients, but each produces $2,500 because more of them accept crowns, veneers, and implant work. That’s $30,000.
Fewer patients. More production. Less chair time, fewer write-offs, and a front desk that isn’t buried in insurance verification.
A full waiting room feels like success right up until you run the numbers. Have you run yours lately?
What Happens When A Fee-For-Service Practice Uses PPO-Style Marketing?
A fee-for-service practice that uses PPO-style marketing attracts patients who are shopping for coverage, not care. The marketing works exactly as designed. It just works for the wrong practice. The warning signs show up fast:
- Most new calls start with “Do you take my insurance?”
- New-patient specials attract people who never come back for treatment.
- Case acceptance stays flat, even as call volume climbs.
- Your front desk spends its day qualifying people who were never going to be a fit.
And here’s the irony. Volume doesn’t even solve the volume problem. In the same ADA Health Policy Institute report, dentists affiliated with DSOs, the practices most built around volume, listed maintaining a full schedule (35.2%) among their top three challenges for 2026.
Volume isn’t a safety net. It’s a treadmill. Why would you step onto it on purpose?
What Does It Look Like When A Practice Switches From PPO Marketing To Fee-For-Service Marketing?
When a practice switches from PPO marketing to fee-for-service marketing, the first thing that changes isn’t the number of calls. It’s who’s calling. Here’s a real example from my work.
A single-dentist practice in an upscale suburb outside Cleveland started moving to fee-for-service in early 2025. The owner did what most dentists do. He hired a traditional SEO agency, rebuilt his entire website, and spent $7,400 on Google Ads over eight months.
About 40 days in, his calls were up 72%. By PPO standards, that’s a home run.
Then he listened to the calls. More than 60% were insurance shoppers.
The agency didn’t do anything “wrong.” It ran a perfectly good PPO playbook. It just never touched the branding a fee-for-service practice lives or dies on: who the practice is for, what it’s known for, and why it’s worth paying for. So the marketing attracted exactly who it was built to attract.
Those results would’ve been great for the PPO practice he was leaving. They were all wrong for the fee-for-service practice he wanted to be.
When he came to me, we started the 4-Sprint System right away. Twenty days later, the calls started to sound different. Fewer “Do you take Delta Dental?” calls. More “How much experience do you have with full-mouth restorations?” and “Can you make my veneers look natural?”
Same phone. Same town. Completely different patients on the other end of the line. Which of those callers would you rather spend your afternoon with?
Why Do So Many Dentists Plan To Leave PPOs But Never Do?
Dentists who plan to leave PPO networks often stay because they’re afraid of losing patient volume, and their marketing gives them no reason to believe otherwise. When every report measures headcount, any dip in new patients looks like proof that leaving was a mistake.
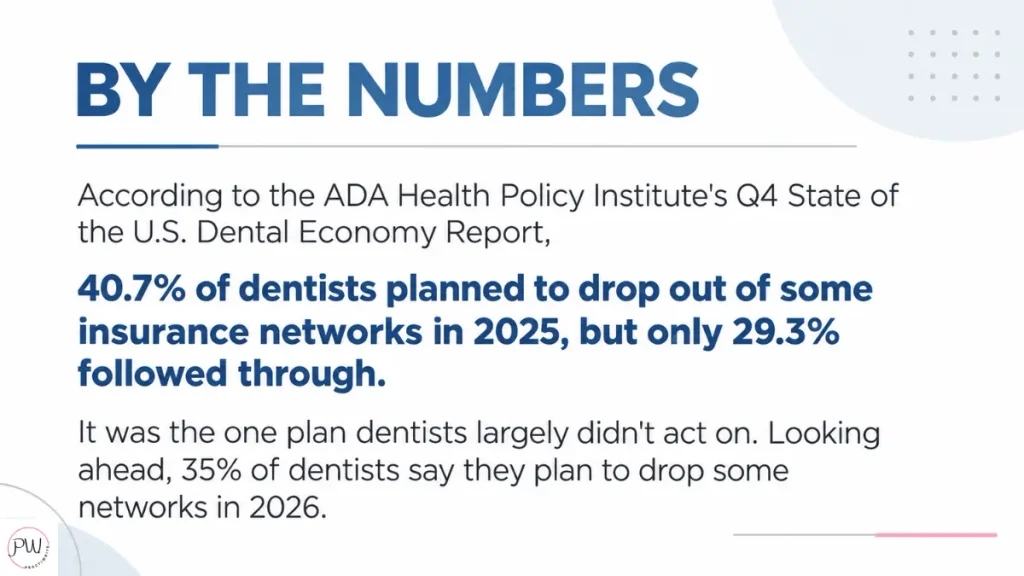
That’s more than one in ten dentists who decided to leave, then talked themselves out of it. Not because fee-for-service doesn’t work, but because they were measuring it with the wrong ruler.
Going fee-for-service doesn’t empty your chairs. Marketing built for the wrong practice does. If 35% of dentists are planning the jump this year, how many will freeze for the same reason?
How Should A Fee-For-Service Practice Judge Its Marketing Results?
A fee-for-service practice should judge its marketing by production, case acceptance, and patient fit, tracked month over month against its own history. Never against a PPO competitor down the street, and never against an “industry average” built on practices that run a completely different model.
Ask these three questions of any agency, or of yourself:
- Does the report show production per new patient, or just the number of new patients? If it only counts heads, it’s a PPO report.
- Can you tell which channel the high-value consults came from? If not, you can’t tell what to invest in and what to cut.
- What are we comparing this month to? Your own baseline tells you if you’re growing. Someone else’s volume tells you nothing.
If the answers make your agency squirm, that tells you something too.
Wrapping Up: What Should You Do Next?
You can’t run a quality practice on a quantity scoreboard. If you’ve stepped away from PPOs, or you’re about to, stop counting heads and start measuring what each patient is worth. Otherwise you’ll read a quiet month as failure and talk yourself out of the best decision you ever made for your practice.
The dentists who make the leap stick aren’t the ones with the most calls. They’re the ones whose marketing knows exactly who it’s calling for.
So find out who your marketing is actually built for.
Schedule your 100% free Dental Practice Roadmap. Your Dental Practice Roadmap is a GBP and website audit that shows you exactly where you stand, what keywords you’re ranking for now, what you should be ranking for, and a step-by-step plan to close those gaps.
No vague recommendations. No fluff. Just a clear picture of what’s broken and what to do about it.
Book your Dental Practice Roadmap and get yours today now.

10+ year content strategist, writer, author, and SEO consultant. I work exclusively with fee-for-service dental practices that want to build value, not volume.